For decades, the neuroscience community around the world endeavored to understand how the human brain undergoes several significant changes over a lifetime and how we interact with it. But they had no source to understand how the brain grows and evolves like how a brain will look at 20 years of age compared to 50?
Now, a team of scientists around the globe has shared the data to map the world’s first brain growth chart. Richard Bethlehem from the University of Cambridge, and Jakob Seidlitz from the University of Pennsylvania, collaborated with scientists across six continents and dozens of institutions for this project.
The scans spanned subjects as young as a few weeks’ fetuses to as old as 100 years
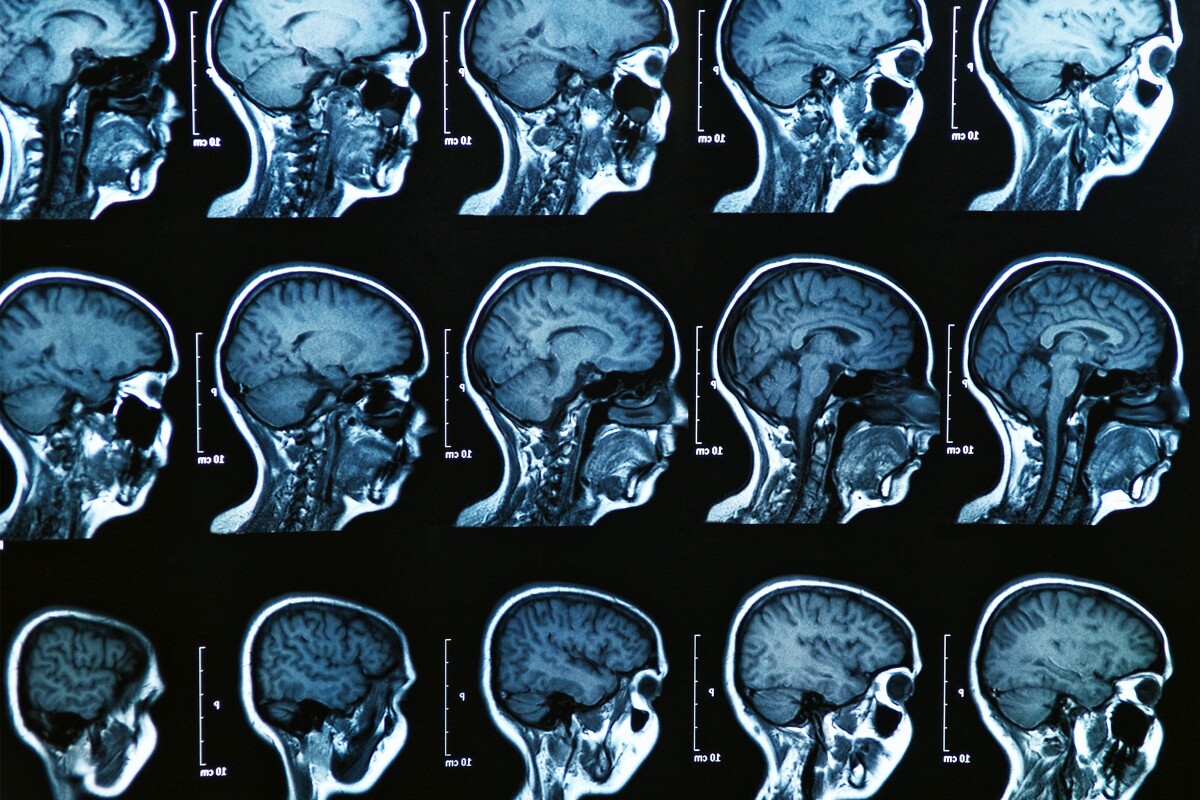
The project incorporated MRI scans of human brains of all ages to create a unique portrait of how our brains change or develop throughout a lifetime. Scientists collated a complex database combining 123,984 magnetic resonance imaging (MRI) scans taken from 101,457 individuals.
Researchers found that while the volume of grey matter in the brain peaks at the age of six, the white matter continues to grow until around 29 years. However, the volume of white matter in a brain begins to decrease at a rapid pace at around 50 years.
Soon the brain charts could be used by doctors as a clinical reference tool
In the future, doctors can compare the MRI scans of their patients by using these reference charts to detect abnormal brain changes.