Over the past 35 years, the ocean has collected a whole lot of garbage, enough to actually form entire ocean garbage patches.
In order to help us visualize the copious amounts of garbage, NASA partnered with NOAA to show how the ocean’s 5 islands of garbage came to be.
Essentially, the ocean garbage patches were formed as a result of the continuous swirling pattern of the ocean, naturally settling into separate patches over the years.
NASA’s Explanation:
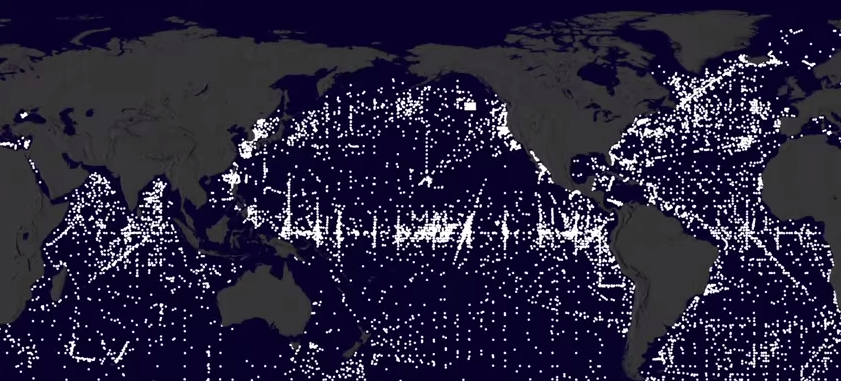
We start with data from floating, scientific buoys that NOAA has been distributing in the oceans for the last 35 years, represented here as white dots. Let’s speed up time to see where the buoys go…
…If we let all of the buoys go at the same time, we can observe buoy migration patterns. The number of buoys decreases because some buoys don’t last as long as others. The buoys migrate to 5 known gyres also called ocean garbage patches.