Eleanor Lutz is a designer who spends a considerable amount of time illustrating nature & technology using the latest data visualization software and techniques. Lutz is from Seattle and carries a degree in molecular biology from the University of Washington.
She has been taking a year off from school in preparation for grad school to work on science illustration projects. Lutz has won numerous scholarships including a Washington NASA Space Grant and Mary Gates Leadership Scholarship. Lutz has also worked with Dr. Jeff Riffell in his lab at the University of Washington on several projects, including olfactory studies and and the Aedes aegypti mosquito.

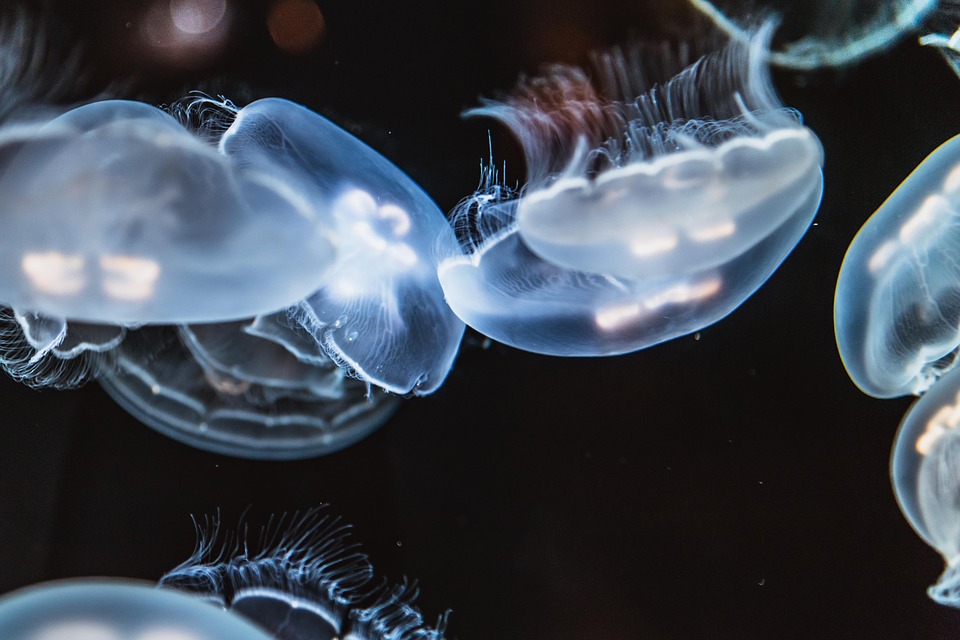
Data Visualization: Illustrating Nature & Technology: Bioluminescence (Image Courtesy www.tabletopwhale.com & Eleanor Lutz)
Lutz uses a Wacom drawing tablet to make infographics and charts based on scientific sources including textbooks and research papers. Lutz uses GIFs to create infographics that are 25-frame stop motion animations made with Photoshop.
She also uses Illustrator, Indesign, GitHub, Inkscape, TileMill 2, HTML, CSS and Jekyll Templating. For more information, visit Lutz at TableTopWhale her personal blog or see more of her work at Dribble.
Related articles on IndustryTap:
- New Application Set To Revolutionize How Designers and Architects Work!
- Pininfarina, The Company That Designs Ferraris, Has Created an $11,000 Bicycle
- Design Firm Transforms Billboards into Mini Houses
- Will.i.am Designs Special Camera Version of Lexus’ NX SUV
- The ‘New Tube For London’ Train Design Looks Like Something From Outer Space
- The Iconic Porsche 911 Is Getting 4 New Designs & They All Look Incredible
- Omron Unleashes Huge Robot Designed For Long Ping Pong Rallies
- State-of-the-Art Physics Software Elevates Paper Airplane Design to a New Level
- Students Design “RoboCouch” For Doing Work Or Being Lazy On The Go!
- NASA Shares Futuristic Designs to Help Explore New Worlds
References and related links:
- Patterns Created by Animals in Flight Revealed in GIFs – Canada Arts Connect
- A Visual Guide To Bioluminescent Creatures
- How 5 Different Creatures Flap Their Wings | Co.Design | business + design